Risk in dollars, not colors

Quantify the risk. Your board wants a security update. Your CFO wants it in dollars. Your team wants a roadmap.

Most security reporting is generic scores and red-yellow-green dashboards that don’t mean anything to the people writing checks. The platform connects your security posture to your actual business — your vendors, your pipeline, your strategic goals — so every risk has a dollar figure and every recommendation has an ROI. That’s how you quantify the risk without hand-waving: expected annual loss, worst-case exposure, and peer percentile benchmark, all traceable to how your business actually runs.
59%of small and mid-sized enterprises experienced a cyber attack in the last 12 monthsHiscox Cyber Readiness Report 2025
+17%average per-incident breach cost increase 2024 → 2025, driven by longer dwell times and larger data-exfiltration volumesIBM Cost of a Data Breach Report 2025
95% / 15%of senior leaders see cyber risk quantification as essential to investment decisions — but only 15–20% have actually deployed itFAIR Institute 2025 State of Cyber Risk Management
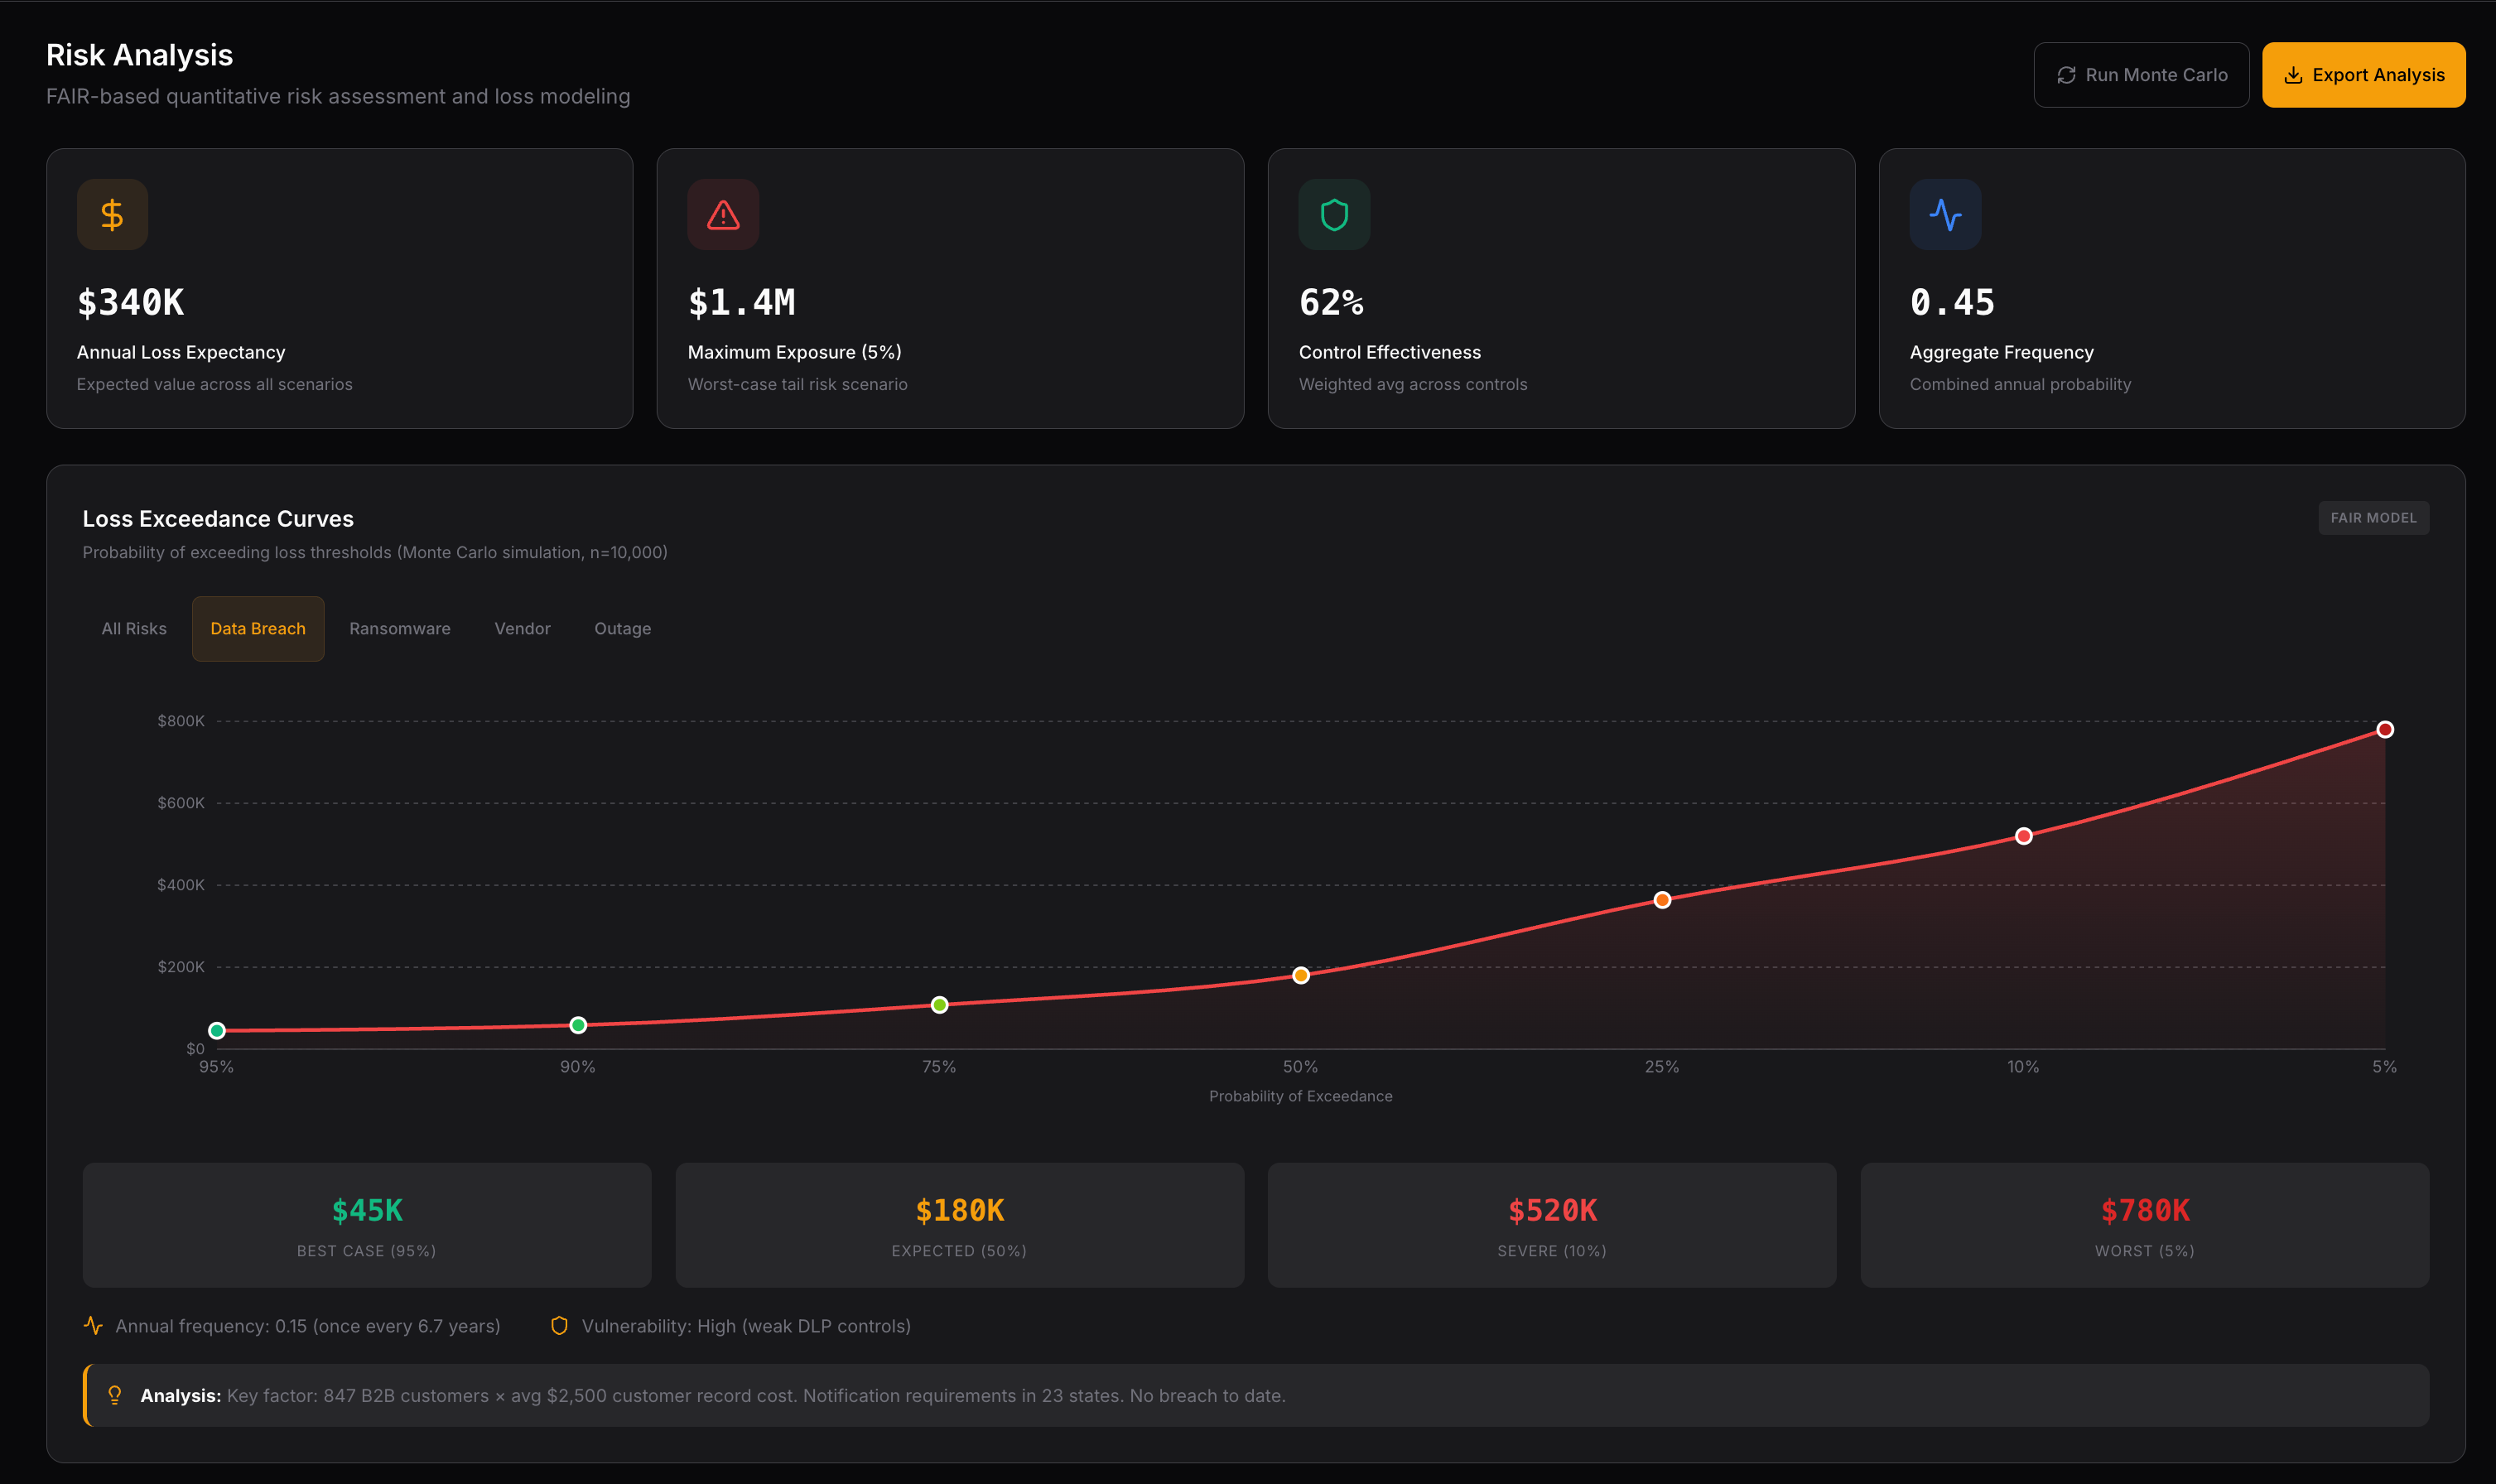
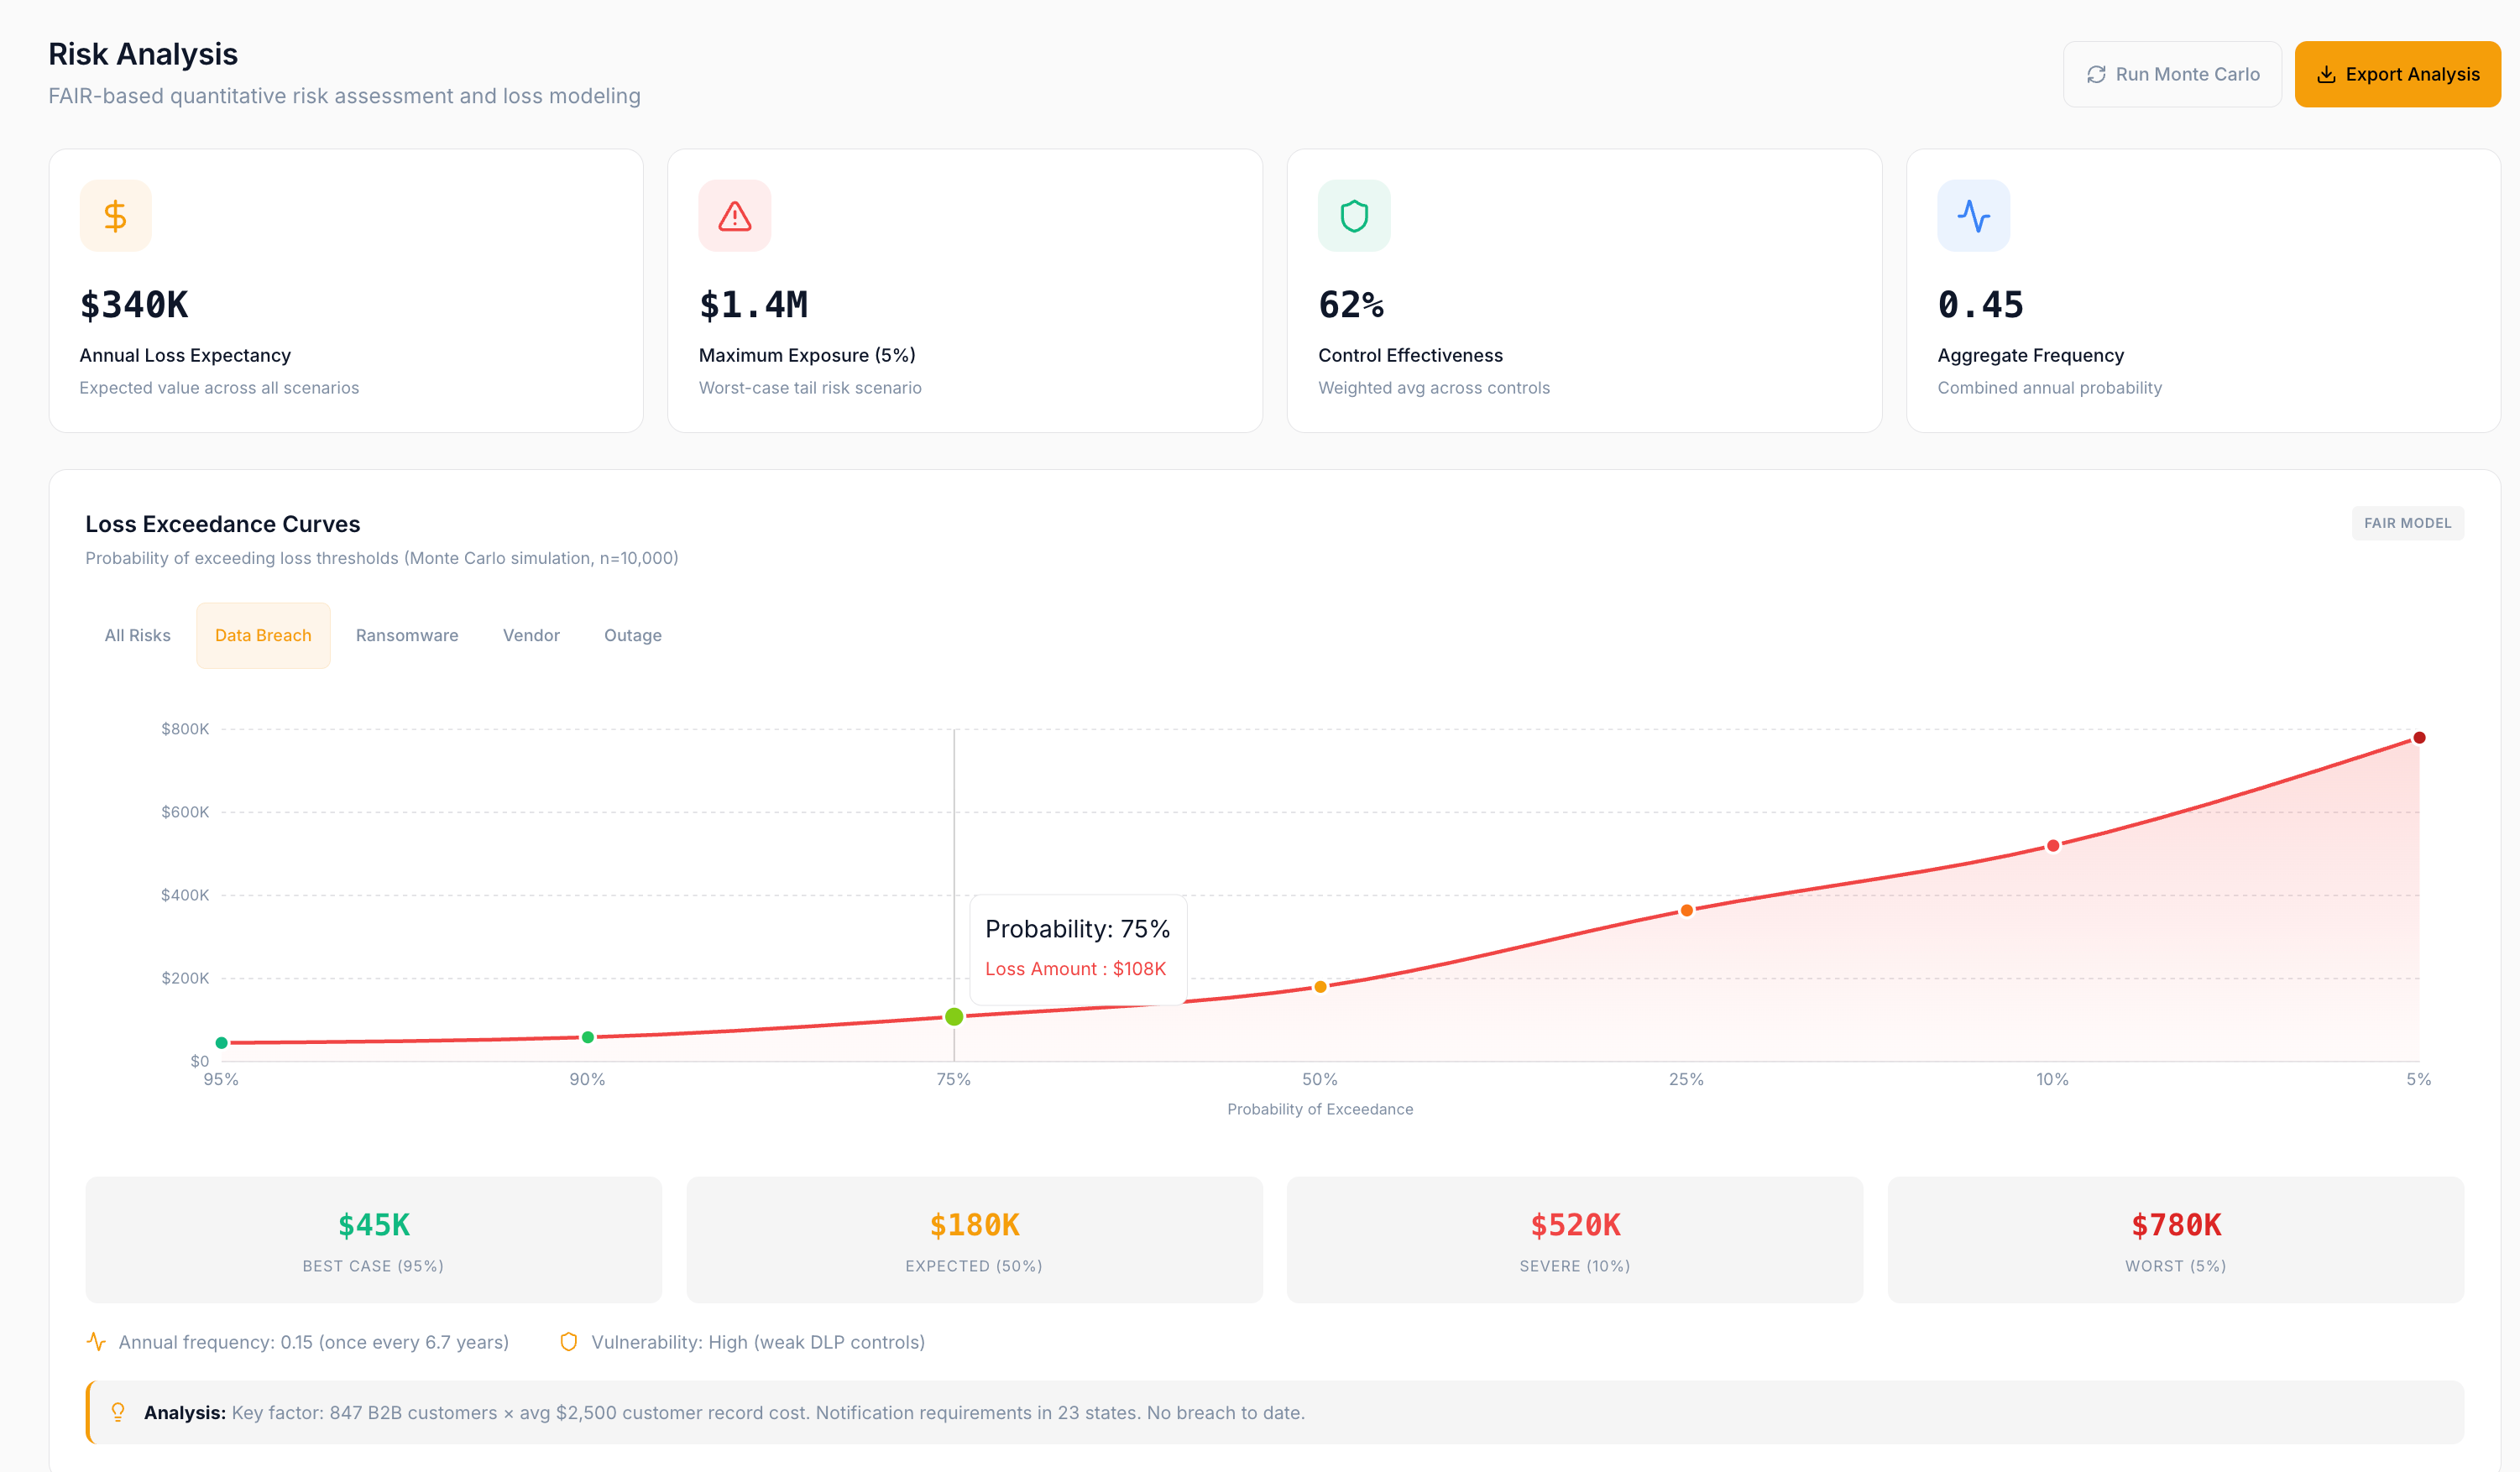
vCISO Lite risk analysis dashboard showing expected annual loss, worst-case exposure, and loss exceedance curve for a mid-market company.
Your CEO asks “what do we invest in next.” Your CFO asks “what is our actual exposure.” Your Security Director asks “where are the gaps and how do we close them.”
Same platform, three answers, one shared source of truth.

The shift

From “I think we’re fine” to “here’s exactly where we stand.”

Three problems most security programs live with, and what changes on the platform.

Today
On the platform
Risk shows up as colors on a heat map.The board asks “is that a big red or a small red?” and nobody has a defensible answer.
H / M / L not budgetable
Every risk is priced in dollars.Expected annual loss, worst-case exposure at P90, and the loss exceedance curve behind both. Comparable, defensible, exportable.
$340K exp. annual loss
Numbers come from an annual consulting engagement.By the time the report is delivered, half of it is already stale. Nobody trusts it, nobody uses it.
~12 mo between updates
Numbers update from your live posture.Every new vendor, every control change, every finding re-derives the exposure figure. The number you see is the one that’s true right now.
< 60 sec to fresh number
Recommendations are unranked and unpriced.A 200-item backlog with no order. Leadership funds the loudest voice in the room, not the highest-ROI fix.
0 / 200 priced by ROI
Every recommendation carries an ROI.Ranked by risk-buy-down. Every fix has a first-year return attached. Spend defends itself, no matter who’s in the room.
200 / 200 priced by ROI

View 01·The board pack·For the CEO

A board update that says something, not one that says everything.

The Executive view ranks every recommendation by dollar impact and shows the two-quarter delta in one page. Complete SOC 2 to unlock $2.1M in stalled pipeline. Close the identity gap to reduce enterprise deal cycles by three weeks. The chart you forward straight to the audit committee, not a heat map that reads “we are doing security.”

  • Priced impactEvery recommendation carries a business-tied dollar value. No color-coded risk registers.
  • Trend, not snapshotQuarter-over-quarter delta on risk position, coverage, and posture. The shape a board actually asks for.
  • One-click exportBoard pack, security strategy overview, or audit summary. Formatted for the audience. Ready to present.

View 02·CFO Talk Track·For the CFO

An exposure number the audit committee can defend.

Every risk scenario ships with a CFO Talk Track: the worst-case narrative, ARR at risk, contract-exit implications, and the specific items that would land on a 90-day SEC disclosure, already translated into the language a CFO uses in front of a board. Pair it with the Continuous Indicators layer inside Allotrope and the number is not just quantified, it’s live.

  • CFO Talk TrackWorst-case narrative, ARR at risk, contract-exit implications, and control-coverage snapshot — one artifact per scenario.
  • Loss exceedanceThe tail-risk chart insurers underwrite against. Yours, defensible, exportable.
  • Coverage vs. exposureThe gap between your insurance limit and your real 95th-percentile exposure, in one number.

View 03·Maturity by security domain·For the Security Director

A roadmap that gets you funded, not a backlog nobody reads.

Maturity scored across every security domain your program covers, cross-mapped to every framework you run — the named standards and any custom framework you define. Test of Design + Test of Effectiveness, benchmarked against peers, with a remediation roadmap sequenced by risk-buy-down. When leadership asks whether security spend is working, the chart is right there. When you ask for the next tranche of budget, the risk-buy-down math justifies it.

  • Every domainGovernance, access, data protection, vulnerability management, incident response, third-party — the whole program, one scoring engine.
  • Every frameworkNamed standards and custom frameworks get the same treatment. One control improvement moves your score against every framework it satisfies.
  • Ranked by impactGaps sequenced by dollar-risk-removed, not alphabetical. Every item has a fix, an owner, and an ROI.

Worked example

The audit committee wants a number.

4:20 PM · TUESDAY

Slack from the CFO: “Audit committee tomorrow morning wants to hear about our cyber risk exposure. Something they can point to. Bring a number.”

01Platform reads your current business context and top risk scenarios6 scenarios
02Runs the exposure model against your live posture, aggregated to a portfolio figure$340K EAL
03Generates the loss exceedance curve out to the 95th percentile$1.2M P95
04Computes coverage-vs-exposure gap against your current cyber policy$700K gap
05Ranks the top three recommended investments by risk-buy-down+$2.1M pipeline
06Exports the audit-committee brief with CFO Talk Track appended3-page PDF
Outcome · 4:37 PM

You send the CFO a three-page brief with a defensible portfolio number, a loss exceedance curve, the coverage gap in dollars, and the top three recommended investments already scored. The audit committee walks away with an answer, not a follow-up question.

Why this is different

Four things that have to be true together.

Plenty of tools do one of these. Nothing else does all four on one platform.

Connected to your business

Risk is priced from your real vendors, your pipeline, and your revenue at risk. Not an industry-average report you could have Googled.

Priced in dollars

Every recommendation carries a business-tied dollar value. Boards understand it. Insurers underwrite against it. Spend defends itself.

Live, not annual

Re-derived continuously from your live posture. The number you see is the one that is true today, not the one from last year’s consulting engagement.

Compounds over time

Every policy, control, and vendor assessment feeds back into the model. Your score improves. Your exposure drops. You can prove both.

Common questions

What buyers ask before signing up.

What does cyber risk quantification actually produce?
A dollar figure. Specifically, an expected annual loss (a single most-likely number) and a worst-case exposure (typically at the 95th percentile), plus the loss exceedance curve behind both — the same tail-risk chart insurers underwrite against. Every input is your real data, and every output is traceable to the vendor, control, or business function it came from.
How is this different from a red-yellow-green heat map?
A heat map tells you something is bad. It doesn't tell you how bad, or how much it's worth to fix. Quantification puts a dollar figure on every risk so decisions become comparable, budgetable, and defensible to a CFO or an audit committee. Heat maps stop at the color; quantification starts there.
What is FAIR and why do you use it?
FAIR (Factor Analysis of Information Risk) is the dominant standard for cyber risk quantification — 45% of organizations use it or plan to, and 90% of adopters report success (FAIR Institute, 2025). It decomposes risk into loss event frequency times loss magnitude with defined sub-factors, so estimates are debatable, updatable, and auditable rather than gut-feel. vCISO Lite's model is FAIR-aligned end-to-end.
Which compliance frameworks do you measure maturity against?
Every framework in your program — SOC 2, ISO 27001, NIST CSF, HIPAA, PCI DSS, CMMC, ISO 42001, DORA, GDPR, and any custom framework you define. Maturity is scored per security domain and cross-mapped to every framework you run, so a single control improvement moves your score against all the frameworks it satisfies.
What is CFO Talk Track and who is it for?
CFO Talk Track is a purpose-built view inside each risk scenario that translates the numbers into language a CFO uses — worst-case narrative, ARR at risk, contract-exit implications, coverage-vs-exposure gap, and the specific line items that would land on a 90-day SEC disclosure. It's the artifact you hand to the CFO before a board meeting so both of you are working from the same page.
How often do the numbers update?
Continuously. Risk figures are re-derived from your live posture — every new vendor, every control change, every finding — rather than sitting frozen between annual consulting engagements. The Continuous Indicators layer (part of Allotrope) surfaces the leading signals so you see the number moving while it's still forming, not in a post-mortem.

For PE deal teams and M&A buyers

The same FAIR-aligned methodology, productized for cyber due diligence at deal speed.

See Quantitative Cyber Diligence

Security shouldn’t be a black box to the people funding it.

See your risk in dollars, benchmarked against peers, with a clear path forward.